
Kepler's Equation: Eccentric Anomaly Values at the Quarter-period - Part 2
I am circling back around to post some additional information about elliptical motion at the quarter period.
According to Kepler's Equation for Elliptical Motion,
E = M + e sin(E) Equation 1
At the quarter period, the Mean Anomaly, M, becomes π/2 and this equation becomes
E = π/2 + e sin(E) Equation 2
A plot of sin(E) at T/4 points for e going from 0 to 1 follows.

This graph, and the data that produced it, are posted on the Desmos website: Plot of sin(E) at the Quarter Period
These data points were computed numerically.
The first column, labelled x1, contains the e values.
The second column is the Eccentric Anomaly, E, at T/4.
The third column is sin(E) at T/4.
This data is available for use, for anybody interested. Feel free to edit it, or plot functions using the data. However, if you want to save your work, you'll have to create your own account first (it's free.)
Equation 2 can be reduced to
sin(E) = cos[e sin(E)] Equation 3
or
x = cos(e x) Equation 4
where x = sin(E).
Note that when e = 1, Equation 4 reduces to the familiar form of the definition of the Dottie Number: x = cos(x). In other words, the Dottie Number is just one point on the curve that solves Equation 4.
Now consider the first derivative of E with respect to (w.r.t.) e. Equation 1 is differentiated w.r.t. e to yield

Equation 5 is used to differentiate sin(E) w.r.t. e:
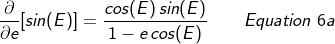
or

A plot of d[sin(E)] / de at the quarter period follows:

This graph, and the data that produced it, are posted on the Desmos website: Plot of d[sin(E)]/de at the Quarter Period
Next, consider the second derivative of sin(E) w.r.t. e:

A plot of d2[sin(E)] / de2 at the quarter period follows:

This graph, and the data that produced it, are posted on the Desmos website: Plot of d2[sin(E)]/de2 at the Quarter Period
This plot takes a zero value at approximately x = 0.643638135454661. This means the plot for sin(E) values at the quarter period has a point of inflection. For 0 < e < 0.643638135454661 the plot for sin(E) is concave down. For 0.643638135454661 < e < 1 the plot for sin(E) is concave up.
At this point, d[sin(E)] / de = -0.33323545 and
d[cos(E)] / de = -0.5446936
Going through similar steps for cos(E), analogous to Equation 3, values for ET/4 can be found as the solution to the equation
cos(E) = -sin[e sin(E)]
When e = 1, cos(ET/4) = - sin(D), where D is the Dottie Number.
Here is a plot of cos(E) at T/4 points for e going from 0 to 1.
The first and second derivatives are


Plots of these derivatives are posted at the following URLs:
First Derivative of cos(E) w.r.t. e at the Quarter Period
Second Derivative of cos(E) w.r.t. e at the Quarter Period
Since the second derivative does not take a zero value over the range of interest ([0, 1]), the curve for cos(E) does not have a point of inflection over this range. Because the concavity of this curve does not change, perhaps it would be more effective to examine features of the cosine curve instead of the sine curve (e.g., a straight line bounding function would not have the risk of the function diverging away from it.)
Here is a plot of cos(ET/4) with two simple bounding functions:
cos(E) at the Quarter Period with Two Simple Bounding Functions
Investigating the cos(E) curve, recall the equation stated above:
cos(E) = -sin[e sin(E)]
Also, consider the infinite series definition of the sine function:

In the present case, x = e sin(E). Notice that a factor of e is present in all terms.
So, cos(E) can be stated in the form
cos(E) = -e F(e)
where F(e) is some function to be determined.
The corresponding form of sin(E) is
sin(E) = √[1 - e2 (F(e))2]
What does a plot of F(e) look like? Here is a plot of F(e) = -cos(E)/e:
Graph of -cos(E) divided by e at the Quarter Period
Note that F(e) goes to 1 as e goes to zero,
and it goes to sin(D) as e goes to 1.
In addition, the series representation indicates that the expression at the sin(E) = sin(M) point could be expressed in a similar form:
cos(EsE=sM) = -sin[(e/2) sin(E)] = - (e/2) F(e/2)
These proposed forms fit the graphs seen so far.
Looking at other properties of E at the quarter period ...
Labels: Dottie Number, elliptical motion, Kepler’s Equation
posted by David_B | 3:47 PM
|
0 comments
![]()